

-

-
Topics:
Part IV - Income Statements
In our last post, we discussed how to read the Balance Sheet, one of several Financial Statements that corporations use to measure the economic health of the company. The Balance Sheet is a static picture of the company, and uses a "money material balance" where Shareholders Equity is simply equal to Assets minus Liabilities on a specific date.

But, as we know from our Heat Transfer and Mass Transfer courses, the material balance doesn't tell the whole story. Similarly, we need the Income Statement to show us movement of money during a period of time. The Income Statement shows the profitability of a company over time and "wipes clean" at the beginning of each period. So, on January 1, we have zero income and we can calculate our income for a month on January 31, for a quarter on March 31, or for a full year on December 31. (Sometimes the Income Statement is called a Profit and Loss Statement.) To Chemical Engineers, the Income Statement is important because it shows the profit (or loss) on operations by the following basic formula:
In short, this equation explains why your boss talks about "cutting costs", since the Gross Income represents Sales (Revenue) less Cost of Goods Sold. You can imagine it's much easier for a refinery manager to control the cost of production than it is to increase either the gallons of fuel sold at service stations or the price that is charged per gallon. Some other expenses include:
- Sales (e.g. salary paid to sales force, advertising brochures, trade shows),
- Administrative (e.g. salaries of accountants and lawyers, support staff, building maintenance),
- General (e.g. paper, computers, safety training), and
- Depreciation and Taxes (we'll talk about these in a future post).
Income Statements are often presented in many different formats. Two popular methods are the Traditional Income Statement,
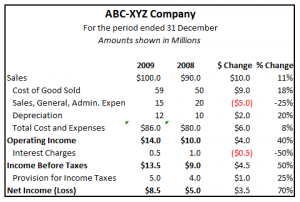
which is required by U.S. law for reporting to governments and stockholders, and the Contribution Margin Income Statement, which is used internally to help guide management decisions. Also, you will want to analyze the Income Statement both horizontally and vertically. In horizontal analysis, you will compare changes in the Income Statement from year-to-year. For example, we will look at the absolute change in Net Income from 2008 to 2009 as well as the percentage change, which is $3.5M for ABC-XYZ Company, a 70% increase from year-to-year. Your bo$$ will want to analyze and understand what caused those changes.We can see that Sales increased by $10M in 2009 over 2008 even though we had an increase of $6M in Total Costs and Expenses. We can also see that we have much lower interest expense in 2009 (only $0.5M) as compared to 2008 ($1.0M). Your bo$$ will then understand how the project you installed in 2008 has directly resulted in cost savings! Vertical Analysis is used to compare financial statements of different companies or the same company over years when there are significant differences in size. You would use Vertical Analysis if you wanted to compare financial results of Big Oil with financial
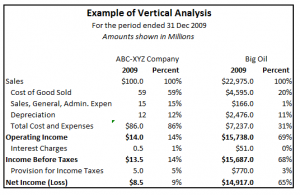
results of ABC-XYZ by normalizing to Sales. Notice that Cost of Goods Sold, for example, amounts to almost 60% of ABC-XYZ's Sales but only 20% of Big Oil's. What does that tell you about the efficiency of operations at ABC-XYZ versus Big Oil? Notice also that SG&A (Sales, General, and Administrative) amount to 15% of ABC-XYZ's Sales but only 1% for Big Oil. Do you suppose that Big Oil may have a more efficient sales staff? Or would you consider that ABC-XYZ has proportionally more or higher paid staff since they are a smaller company? Which company do you think is more profitable and in which company would you invest?
How do you think Net Income impact Cash Flow?
Unless the business has sufficient cash on hand to pay employees, suppliers, and utilities, no products will be manufactured or sold. So, your bo$$ and the bank are very likely to worry about Cash Flow, which shows up on the Cash Flow Statement.
Do you think it's possible to have a positive Net Income and a negative Cash Flow?
Stay tuned for our next blog post and we'll answer that question!
Comments
As an engineer at a publicly held company I am amazed at the emphasis placed on performance is some of these "key" financial areas. There is always a push to increase cash flow and decrease receivables - though few in the company are in position to actually effect this. We are constantly reminded to enter timesheets on time so that billing and expenses can be accounted for in the correct quarter - since otherwise salaries might look like an "unexpected" expense and thus a marker of a poor investment choice. While I understand that individuals aggregate to a total effect and good book keeping is essential for a business, sometimes it seems like publicly held companies overemphasis the short term numbers to look good for investors at the risk of long term success. But I make sure to follow the rules since we all get company stock. What do you think is the value of these numbers in the short term - like quarter to quarter? What would you think would be the minimum number of data points to get a good extrapolation?
My pleasure - thanks for the detailed response. My understanding of the S-Ox requirements is while they require more detailed accounting, they do not involve comparing quarter to quarter and extrapolation of any trends. That is done by the business-types. And they over analyze. I agree, tracking quarter to quarter is good for setting reference points and seeing changes. But to see profit go up or down 5% and see that as "all problems are fixed" or "the world is ending" seems a bit extreme. Especially if there are other financial gymnastics being performed in other areas of the balance sheet that could easily cause those changes. To use your example - if the temperature was going down, you might check the temperature sensor before ordering a catalyst reload.
Great post! Some of the company-wide strategic decisions may be based on the yearly financial reports, but a lot of the day to day decisions are done without the big picture in mind. It is vital for a company to have a good handle on what it actually costs to build a product (including material costs, raw material freight, manufacuring costs, overhead etc.) which activitiy-based costing does a fairly good job assessing this. If we don't have a good handle on this, the CGS won't be accurate, but worse the company could make poor decisions in regards to the future of the product. Some companies have had tunnel vision when looking at cost savings and end up outsourcing most of the products from their factory, fail to replace the volume and end up spending more because the fixed overhead costs don't just leave when the product does. The big picture is so important to making wise financial decisions and it is really important for companies to spur good decisions with appropriate measurements and KPIs.