
 The yearly Lawrence Livermore National Laboratory Energy Use Survey was a mixed bag: the nation is using less energy overall, while managing to rely on more renewable energy at the same time.
The big picture could have been easily predicted: A weak economy caused an overall drop in energy use from 99.2 quadrillion BTU's in 2008 to 94.6 quadrillion BTU's in 2009. Drill down shows that an average U.S. home uses about 95 million BTU's each year, and less spending (including slowing industrial and transportation activity) goes a long way toward explaining the decline. The study adds a positive note:
The yearly Lawrence Livermore National Laboratory Energy Use Survey was a mixed bag: the nation is using less energy overall, while managing to rely on more renewable energy at the same time.
The big picture could have been easily predicted: A weak economy caused an overall drop in energy use from 99.2 quadrillion BTU's in 2008 to 94.6 quadrillion BTU's in 2009. Drill down shows that an average U.S. home uses about 95 million BTU's each year, and less spending (including slowing industrial and transportation activity) goes a long way toward explaining the decline. The study adds a positive note:
At the same time, higher efficiency appliances and vehicles reduced energy use even further," said A.J. Simon, an LLNL energy systems analyst who develops the energy flow charts... "As a result, people and businesses are using less energy in general."If you go back to 2007 when US energy use peaked at 101.5 quadrillion BTU's, then the two year drop has been substantial. This is a dramatic graphic of the U.S.'s 2009 energy economy (click for larger image):
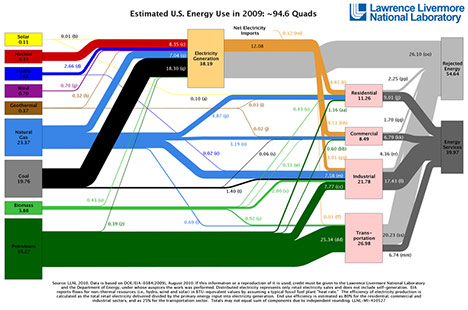 Image: Lawrence Livermore Laboratory
The chart's left side (for more detail go to this PDF ) shows the energy sources and the amounts (notated in quads) each produce. Moving to the right, pink boxes show where energy is consumed and the grey areas show where energy is lost. For longer term comparisons also use the 2008 PDF. Pay special attention to the industries that lose energy.
Image: Lawrence Livermore Laboratory
The chart's left side (for more detail go to this PDF ) shows the energy sources and the amounts (notated in quads) each produce. Moving to the right, pink boxes show where energy is consumed and the grey areas show where energy is lost. For longer term comparisons also use the 2008 PDF. Pay special attention to the industries that lose energy.
Reading the Tea Leaves
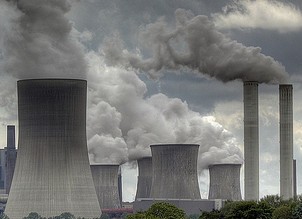
The good news: a decline in fossil fuel use.- Significantly less coal and petroleum were used in 2009 than in 2008
- A decline in natural gas use
- Nuclear energy use remained flat
- Increases in wind, solar, hydro and geothermal power generation

One of the most positive trends was the jump in wind power from .51 quads in 2008 to .70 in 2009, helping to marginally reduce the use of coal for electricity generation. But the chart below dramatically illustrates the small contribution of renewables and the distance to a sustainable energy economy:
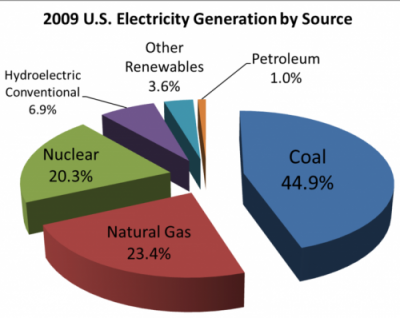 image: Wikipedia, CC
Still, the scientists and analysts at Lawrence Livermore Laboratory are guardedly optimistic:
image: Wikipedia, CC
Still, the scientists and analysts at Lawrence Livermore Laboratory are guardedly optimistic:
"The increase in renewables is a really good story, especially in the wind arena," Simon said. "It's a result of very good incentives and technological advancements. In 2009, the technology got better and the incentives remained relatively stable. The investments put in place for wind in previous years came online in 2009. Even better, there are more projects in the pipeline for 2010 and beyond."Read the original LLNL press release.
Which energy source scales easiest to quickly reduce the reliance on fossil fuels?
What do you think?
Image: coal plant: davipt via Flickr image: wind turbine: Creative Commons Attribution 2.0 Generic
Related articles by Zemanta
Comments
What a telling picture. The amount of energy lost is simply amazing. There sure is some significant room for improvement there - and I am sure that a lot of it won't even need any new technology. Seems that we should be concentrating on capturing more useful energy out of the electricity generation process. I also think that this is the weakest link in the electric car campaign. Conversion of produced electricity into "Energy Services" needs to be near 90% in order to achieve that same total efficiency as traditional fuels.
- Log in to post comments