
Now that the US Energy Information Administration has unveiled an expanded interactive mapping tool that displays the locations of oil and gas wells across the United States, users can track trends across specific plays, starting on a regional level, where busy oil and natural gas exploration has transformed wide swaths of Texas, North Dakota and the Northeast, and then they can drill down to find each well.
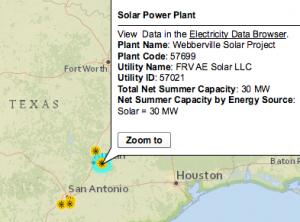
![]() With this addition, users can see every facet of the complex US energy landscape, from the upstream oil and gas plays, to midstream pipelines, and downstream refineries and power plants, including fossil fuel, nuclear, wind, solar and biomass. Integrated into one tool, it's an evolving energy ecosystem at your finger tips.
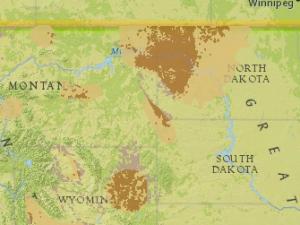
If, for example, you're reading about how two-thirds of the production in North Dakota's Bakken shale oil field rides the rails because of a shortage of pipelines, you can easily toggle between a graphic of the densely clustered area (highlighted in brown on map below) hugging the Canadian border and another showing the limited number of pipelines leaving the area.
With this addition, users can see every facet of the complex US energy landscape, from the upstream oil and gas plays, to midstream pipelines, and downstream refineries and power plants, including fossil fuel, nuclear, wind, solar and biomass. Integrated into one tool, it's an evolving energy ecosystem at your finger tips.
If, for example, you're reading about how two-thirds of the production in North Dakota's Bakken shale oil field rides the rails because of a shortage of pipelines, you can easily toggle between a graphic of the densely clustered area (highlighted in brown on map below) hugging the Canadian border and another showing the limited number of pipelines leaving the area.
 The EIA's mapping tool isn't the only new data source tracking the United States oil and gas boom. Last October, the EIA started issuing a monthly report on new well productivity. This helps shed light on the vigor of the boom. This close look also includes the decline rates of old wells and overall production in six drilling hot spots.
The six regions - including the Eagle Ford Shale, Permian Basin, and Haynesville Shale in parts of Texas - accounted for 90 percent of domestic oil production growth and virtually all U.S. natural gas production gains from 2011 to 2012, as energy companies combine hydraulic fracturing and horizontal drilling to unlock the hydrocarbons buried deep underground.
The EIA's mapping tool isn't the only new data source tracking the United States oil and gas boom. Last October, the EIA started issuing a monthly report on new well productivity. This helps shed light on the vigor of the boom. This close look also includes the decline rates of old wells and overall production in six drilling hot spots.
The six regions - including the Eagle Ford Shale, Permian Basin, and Haynesville Shale in parts of Texas - accounted for 90 percent of domestic oil production growth and virtually all U.S. natural gas production gains from 2011 to 2012, as energy companies combine hydraulic fracturing and horizontal drilling to unlock the hydrocarbons buried deep underground.


